Census 2020

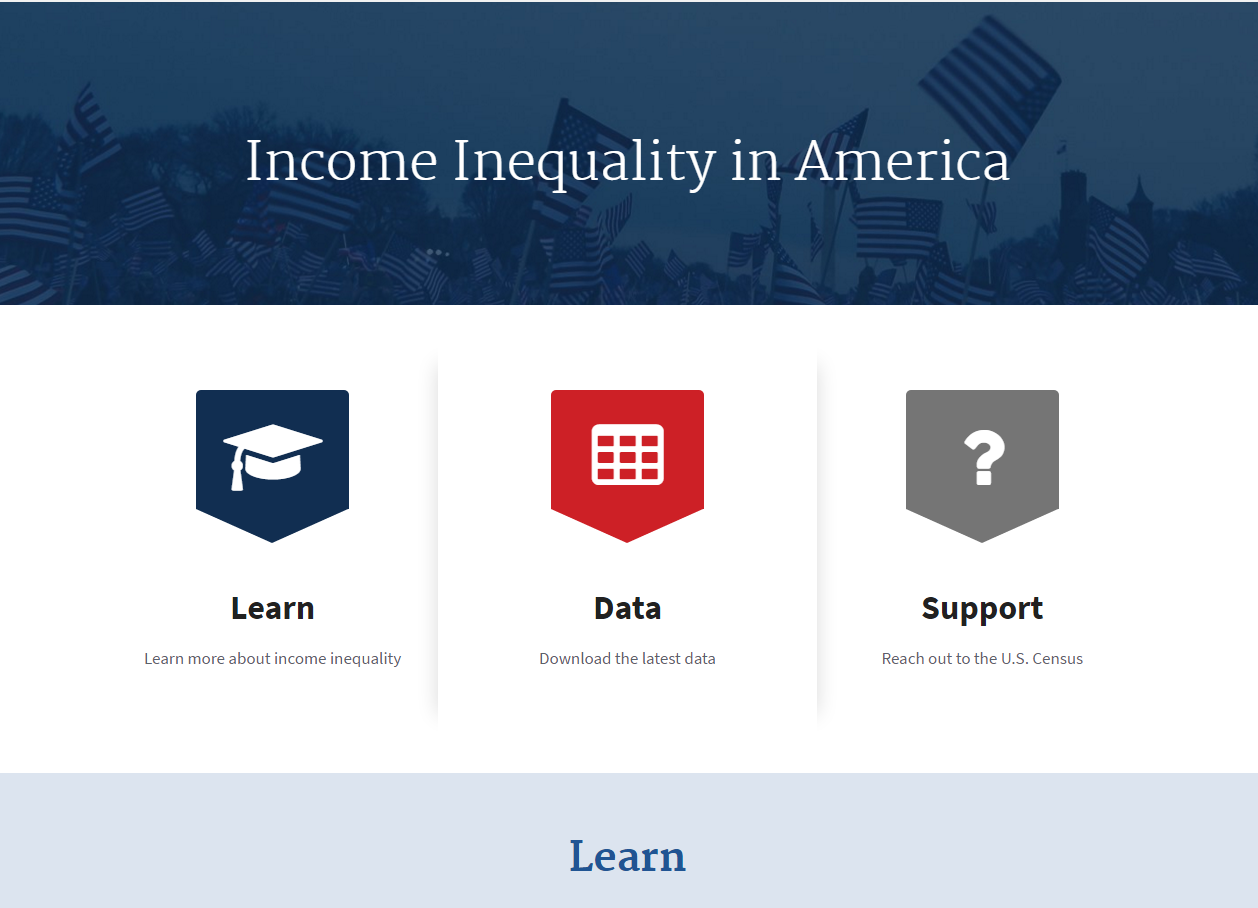
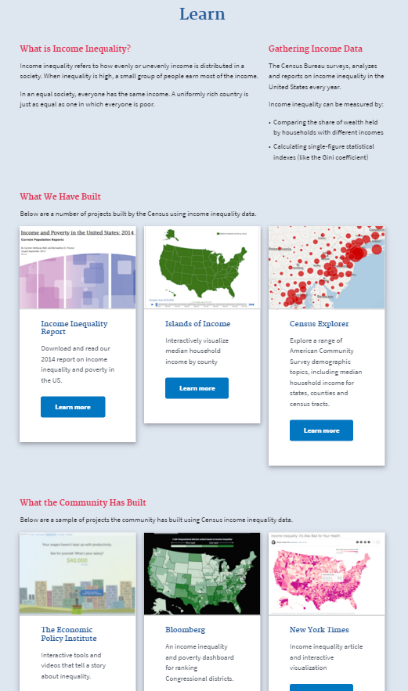
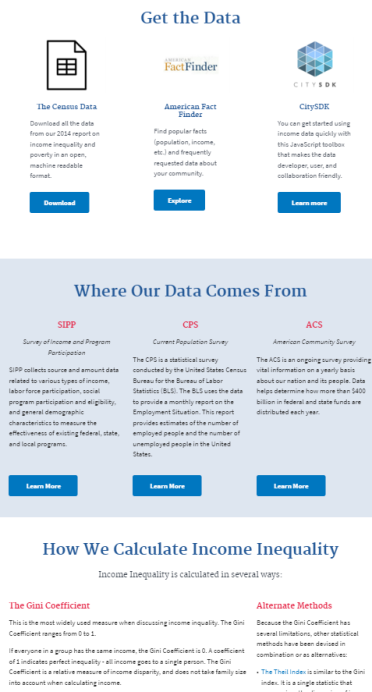
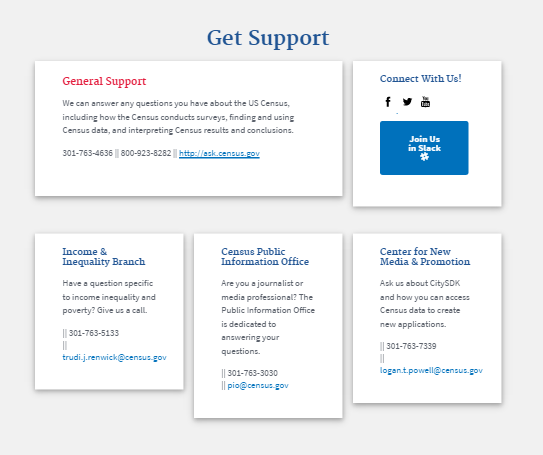
This post is the last in a series produced for a Harvard Kennedy School field class on innovation in government. Our team has been working with the U.S. Census Bureau. You can learn about our journey through our blog and our final presentation. You can find our prototype for a re-imagined income inequality topic page here.

In roughly three years, the U.S. Census Bureau will begin collecting data for the next decennial survey—Census 2020. The Bureau’s operational plan has already been released and collection testing is underway. The question we’ve been thinking about as we conclude our project with the U.S. Census Bureau is:

When a user visits census.gov, what will they see?

What experience will they have?

We’ve kept this question in our mind as we created our five policy recommendations for the U.S. Census Bureau. Along with our prototype and user research, these recommendations are our final deliverables to our client.

The above shows our five policy recommendations, informed by user research and conversations with our colleagues at the Census Bureau

The above shows our five policy recommendations, informed by user research and conversations with our colleagues at the Census Bureau

First, the 2020 census user should land on a website with a simplified look and feel. Users find the current website overwhelming and difficult to navigate. When we visited Census HQ, we saw a number of technology modernization projects currently underway to address this. These projects align with many of the insights we uncovered in our research, and could be even more effective if focus is placed on testing with real users early and often. 

While the Census is hard at work reinventing content management and customer service, there isn’t a project to redesign the census.gov homepage and simplify the site structure. To fill this gap, the Census Bureau should initiate a project to redesign Census.gov.

Census should initiate a project to redesign the Census.gov homepage (current homepage pictured above)

Census should initiate a project to redesign the Census.gov homepage (current homepage pictured above)

Second, the 2020 census user should see how the Census Bureau fits within the ecosystem of government and non-government data partners. We found that users rarely start and end their data searches at Census.gov. They often visit other data sources and consume data-based research and media related to their search.

To cater to this user need, the U.S. Census Bureau should partner with innovative data organizations—both inside and outside government—and feature the work of others alongside their own. By engaging with other agencies and data experts, Census can offer its expertise to the data community and invite suggestions for improved content. For example, Census.gov could feature valuable data visualizations, like Data USA, to show how organizations are making new use of Census Bureau data.

Data USA is an example of an innovative website, built outside government using Census Bureau data. The Census Bureau should partner with organizations like Data USA.

Data USA is an example of an innovative website, built outside government using Census Bureau data. The Census Bureau should partner with organizations like Data USA.

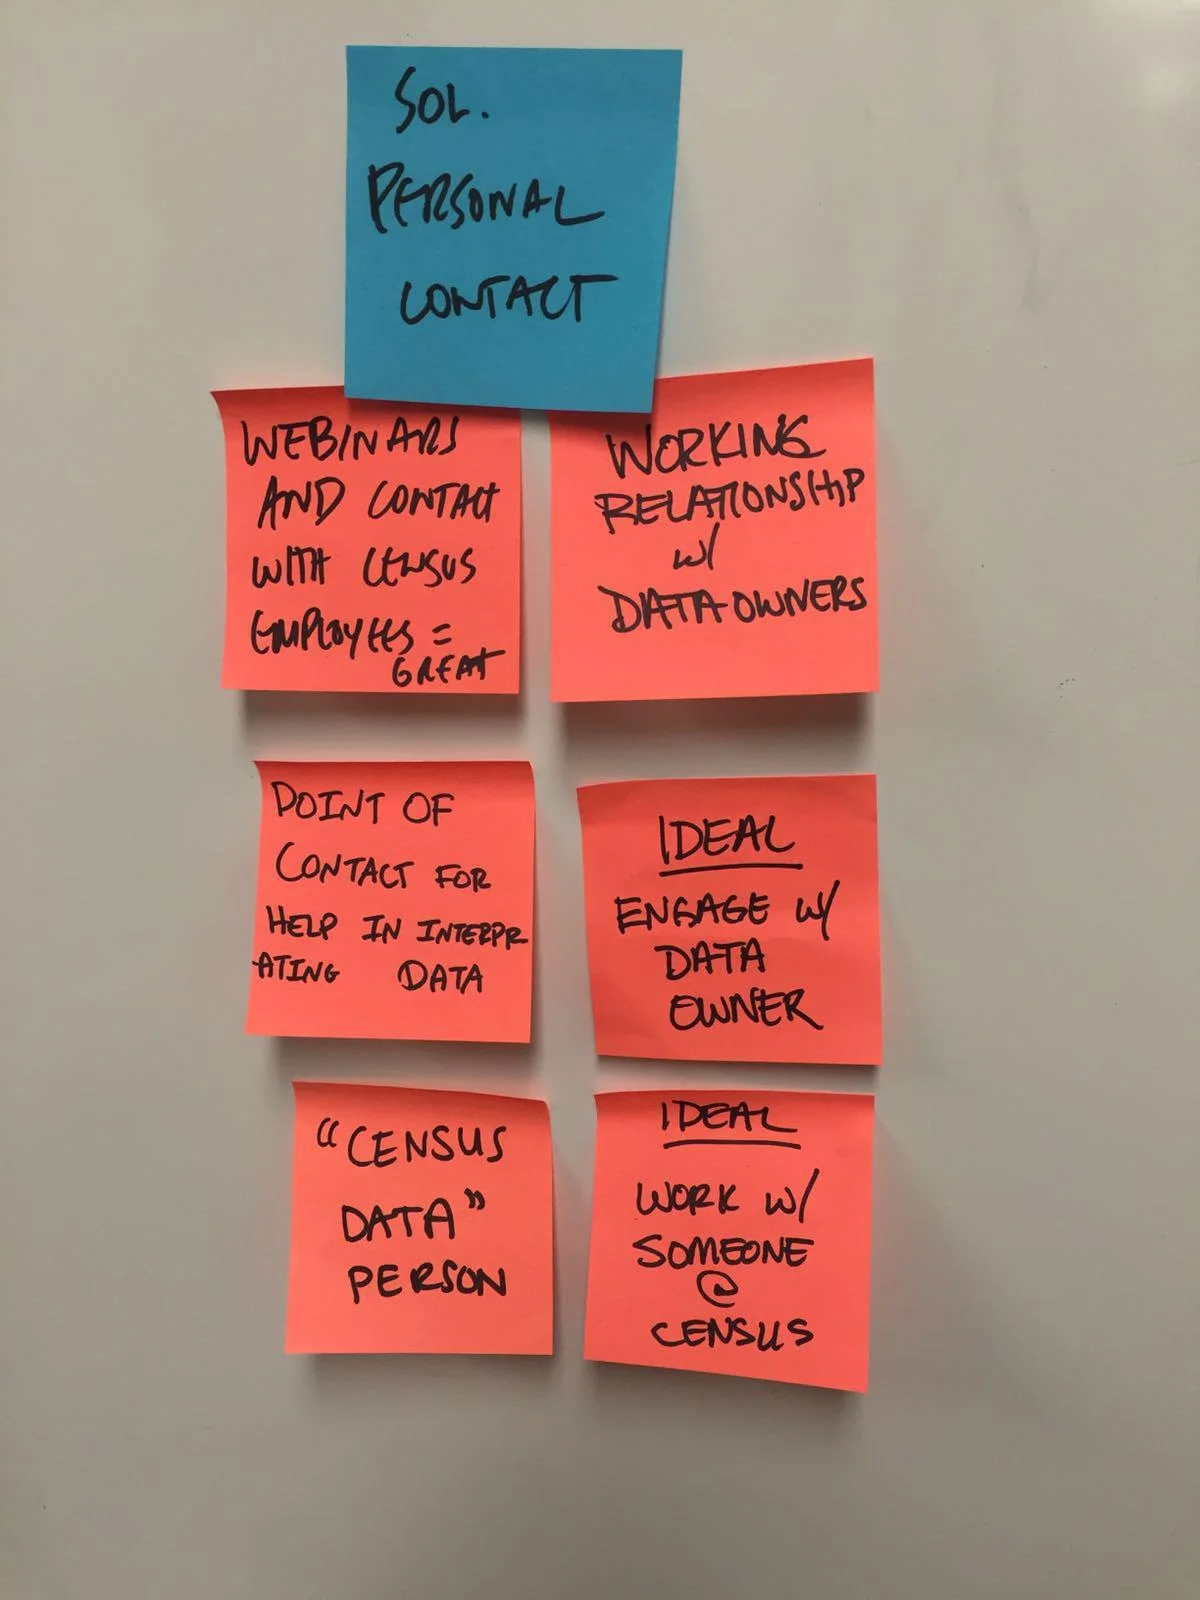
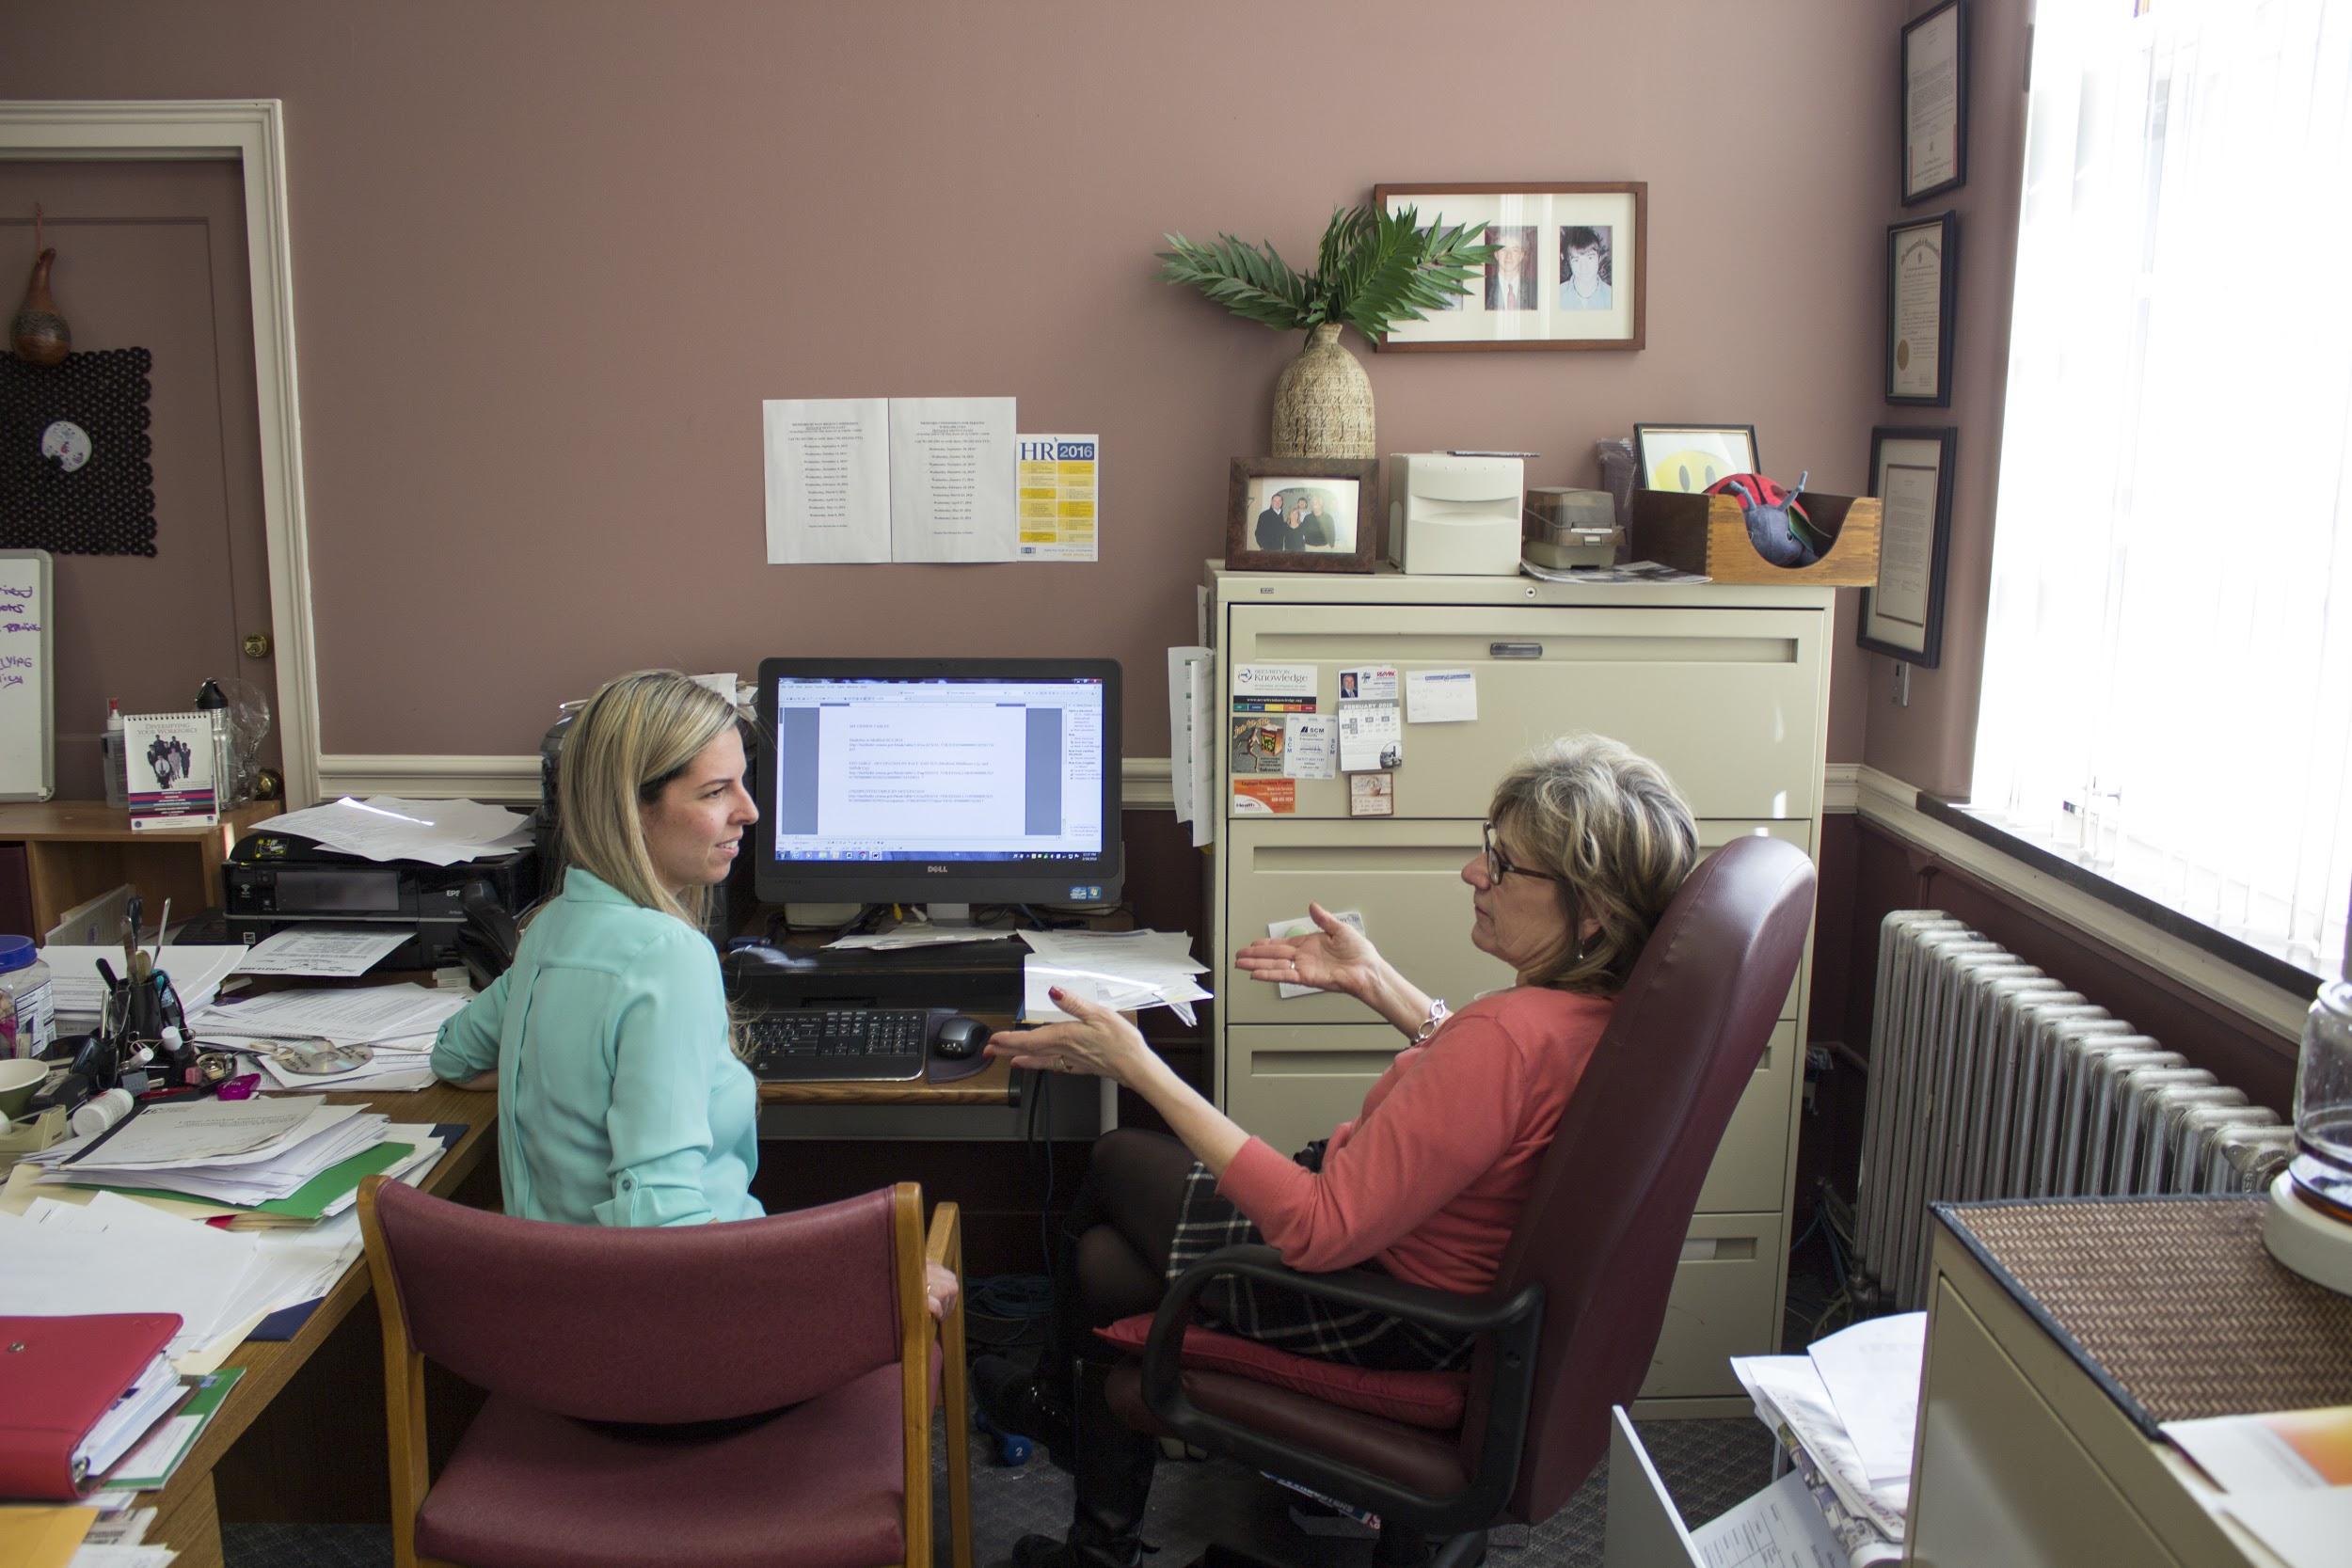
Third, the 2020 census user should clearly understand how to get support. Currently, the U.S. Census Bureau invests significant resources in support. When users do access support, we found their experience was overwhelmingly positive. However, users sometimes struggled to understand which support channel was most appropriate for their request, and this sometimes deterred them from contacting the U.S. Census Bureau.

A first step would be for U.S. Census Bureau to clarify the specific mandate of different support bodies—e.g. clarifying the differences between Census Regional Offices vs. Census Information Centers vs. State Data Centers vs. Data Dissemination Specialists. The U.S. Census Bureau can then communicate clearly to users where to go to find the support they need.

Our prototype provided a more intuitive support section, designed to quickly direct users’ queries to the appropriate Census Bureau channel.

Our prototype provided a more intuitive support section, designed to quickly direct users’ queries to the appropriate Census Bureau channel.

To achieve these recommendations, the U.S. Census Bureau should continue to add talent with skills in user experience and front-end design. The U.S. Census Bureau has already begun to do this, especially in the Center for New Media and Promotions (CNMP) team. The U.S. Census Bureau should continue this effort and also create an internal community for staff not part of the CNMP team but who are interested in user experience and design.

Signing off: this is our final blog post! Our final presentation, covering all our work across user research, prototyping and recommendations is available here. We would like to thank our colleagues and friends from the U.S. Census Bureau for their patience, passion and support. We have learned a great deal and look forward to continuing to contribute to the U.S. Census Bureau’s important mission in the future.

Luciano Arango, Nidhi Badaya, Aaron Capizzi, Rebecca Scharfstein, Peter Willis

Prototyping Income Inequality

This post is the fourth in a series produced for a Harvard Kennedy School field class on innovation in government. Our team is working with the Census Bureau. You can read about our project here, our experience interviewing and engaging Census users here, and see the results of our user research here.

Two weeks ago, we shared how we arrived at a key insight from our user research. This week, we translated our key insights into a low fidelity prototypecheck it out! Driven by our user research, we revisited our problem statement:

How might we improve user experience—search, retrieval and incorporation—of U.S. Census data, particularly income distribution data?

We ultimately decided to prototype a webpage about Income Inequality in America, the precise product we promised ourselves at the outset we would avoid! Here’s how we arrived at this unlikely solution:

We brainstormed potential solutions. We conducted an unconstrained brainstorming session, assessing each and every idea proposed. To structure this process, but also allow for creativity, we examined other industries where users need assurance they are using a product correctly, one of the main concerns Census users raised. How did these industries address the need for assurance? How do they build trust?

One industry we discussed was online shopping. Online shopping websites assure customers that they are purchasing an item that will fit, without the customer trying on the item. Companies can do this because they provide customer service representatives who answer questions and respond to concerns live. They also provide photographs, product dimensions, and user reviews to increase transparency and reduce uncertainty.

Our team brainstormed a list of strategies that companies use to build trust and assurance with their customers.

Our team brainstormed a list of strategies that companies use to build trust and assurance with their customers.

We refined our list of ideas. Following our ideation session, we refined our list of potential prototypes. Some ideas that surfaced were:

  • Census StackExchange, a curated Q&A service for data;

  • Short summaries for data sets (a “peak inside”); and

  • A Twitter campaign where users could post their questions with the hashtag #AskAlexandra (one of the Census Data Dissemination team members).

In addition, we discussed our approach and ideas with three experts: Ben WillmanJeff Chen, and Jeff Miesel. They helped us realize that we had real power as a group of Harvard students to take risks that the U.S. Census Bureau could not take. With this in mind, we further refined our list of potential prototypes.

We also visited the U.S. Census Bureau in Suitland, Maryland to assess the feasibility of our prototype ideas and receive feedback. While there, we developed a deeper understanding of the various work streams, projects, and conversations happening at the Bureau. These meetings brought us a key insight that would help us chose our prototype: Census is already working on addressing the key insights from our user research.

Left to Right: Peter Willis (HKS ’17), Logan Powell (U.S. Census Bureau), Rebecca Scharfstein (HKS/HBS ’18), Trudi Renwick (U.S. Census Bureau), and Alexandra Figueroa (U.S. Census Bureau).

Left to Right: Peter Willis (HKS ’17), Logan Powell (U.S. Census Bureau), Rebecca Scharfstein (HKS/HBS ’18), Trudi Renwick (U.S. Census Bureau), and Alexandra Figueroa (U.S. Census Bureau).

As we learned about these projects, we tested whether the U.S. Census Bureau was incorporating the perspective of users outside of the Bureau, like those we had spoken to in our research. Although the team has adopted an agile approach, it seems that user testing is limited. Too often, Census focuses on “power stakeholders,” important internal stakeholders.

Encouraged by Erie Meyer, we saw the hesitation to engage outside users as an opportunity. We realized we could develop a prototype that complements projects already underway at the Bureau but is grounded in a user-centered approach. Our prototype could act as blueprint for the U.S. Census Bureau to increase user involvement in its projects.

We decided on a prototype and got to work. We decided to develop a low fidelity webpage, a re-imagination of what the current income inequality topic page on the Census website could look like. We hope that our webpage will provide a more streamlined user experience, and we plan to test it alongside the current page.

As far as we could tell, no project at the U.S. Census Bureau has a mandate to re-imagine the website layout and structure. Perhaps it’s too risky or radical. However, if we can prove that an alternative website structure is better for users, we may be able to encourage the Bureau to invest resources in a front-end development project.

Our prototype contains three main sections: learn, data, and support.

  • Learn. In the “learn” section, we provide a definition of income inequality, show how the Census collects income inequality data, and offer a selection of tools developed by the Census and the community. These resources aim to address the insights that data can overwhelm and deter users and that users want assurance they are using data properly.

  • Data. In the “data” section, we identify where users can get income inequality data, describe where the data comes from, and explain how the Census calculates income inequality. As with the “learn” section, these features address user concerns around the overwhelming quantity of Census data and the uncertainty that data is being used properly.

  • Support. Our final sectionthe “support” sectionprovides various avenues to obtain personal support should a user have difficulty accessing or understanding Census’ data. This directly addresses the insight that users value personal support.

Next up: We will be conducting user testing on our prototype in the coming weeks to see if we have effectively addressed the key insights from our user research. If you are interested in providing feedback, tweet at us@beccascharf @willispb @NidhiBadaya @whoslucianoor e-mail us at innovategovernment@gmail.com.

Luciano Arango, Nidhi Badaya, Aaron Capizzi, Rebecca Scharfstein, Peter Willis

The Quest for Meaning in User Research

This post is the third in a series produced for a Harvard Kennedy School field class on innovation in government. Our team is working with the Census Bureau. You can read about our project here and about our experience interviewing and engaging Census users here.

Previously, we talked about the importance of interviewing and observing people using Census data. This week, we have been working to find the meaning in our research. What did we find, and why does it matter? And what are the similarities and differences among the experiences of the 18 different people we interviewed?

One of our most interesting findings is that some Census users need assurance they are using data properly.

Here’s how we got there:

Step 1. We summarized our interviews into “one-pagers.” After each user interview, we documented our findings. The summary of our conversation with Denise-Marie Ordway, a reporter who worked with the Orlando Sentinel and The Philadelphia Inquirer, is below. Denise told us that she is unlikely to use data if she can’t check her interpretation of it with an expert.

Interview summary for Denise-Marie Ordway, Journalist.

Interview summary for Denise-Marie Ordway, Journalist.

Step 2. We identified attitudes and behaviors by user group. After reading the interview notes for each conversation, we wrote down interesting behaviors and attitudes on post-it notes. To avoid bias, we each read interview summaries for users we did not personally speak to.

Consistent with our initial methodology of splitting users into professional groups, we placed the post-it notes under three green headings – journalists, NGOs and academics (pictured below). We wrote Denise’s comment that she is unlikely to use data if she can’t check her interpretation on a pink post-it note and placed it under the heading “Journalist.” 

Nidhi and Aaron arrange insights under user groups for an initial assessment of attitudes and behavior.

Nidhi and Aaron arrange insights under user groups for an initial assessment of attitudes and behavior.

Step 3. We grouped insights by theme. We removed the green user group post-its and began to re-arrange the pink post-it notes in themes (pictured below). We immediately saw that there were common themes across groups, shared behaviors, and similar pain points. These themes are documented on the blue post-it notes.

Peter rearranges insights in themes in order to help us visualize key insights across user groups.

Peter rearranges insights in themes in order to help us visualize key insights across user groups.

Step 4. We generated key insights. We now had eighteen themes on the board. Denise’s comment was now located under the heading “Solution – Personal Contact.” There were five other post-its with similar concepts, including: “Ideal would be to engage with data owner at the Census,” “Ideal would be to work with someone at the Census,” and “Would like a point of contact for help in interpreting data” (see below). 

Post-it notes across user groups related to “Solution – Personal Contact”

Post-it notes across user groups related to “Solution – Personal Contact”

Denise’s comment was not an outlier! We knew we had discovered something important. Thinking back to our original conversation with Denise, we realized that part of the desire for personal contact was related to her lack of confidence in interpreting the data. We had arrived at a key insight: Census users need assurance they are using data properly.

Next up: We are finishing our research phase and using our insights to develop user personas. We plan to visit the Census Bureau in Washington, D.C., brainstorm potential solutions, and test them with users. We’re looking forward to collaborating with Ben Willman, Director of Strategy at the Presidential Innovation Fellows program, on our prototyping approach.

Luciano Arango, Nidhi Badaya, Aaron Capizzi, Rebecca Scharfstein, Peter Willis

Learning to Listen with Our Eyes


This blog is the second in a series produced for a Harvard Kennedy School field class on innovation in government. Our team is working with the Census Bureau. You can read about our project here.

How do you know what someone really needs from a website? What questions do you ask? And how do you know when you’ve heard something really important?

We’ve been thinking about these questions a lot. In this section of our field class, we are researching the behavior of Census users. We’ve been learning that watching someone use a website—“listening with our eyes”—can be a powerful way of uncovering preferences and learning about user needs.

Diane’s story. The other week, in Medford, Massachusetts, we accompanied a Census outreach professional who met with Diane McLeod, the Director of Human Diversity and Compliance for the City of Medford.

Ten fire-fighters and police officers in Medford are retiring next year. Diane intends to replace them with new employees from diverse backgrounds.

It turns out Census has the exact data Diane needs. In the mostly likely scenario, Diane would need to:

  • Find and download data on the current demographic profile of Medford and its surrounding areas;

  • Filter the data to see the number of people who have been employed as fire-fighters or police officers; and

  • Filter the data again to see how many of those fire-fighters and police officers are currently unemployed.

We watched Diane try and find this information on Census’s website.

After first finding the main Census homepage, Diane was confused about what to do next. She tried clicking the “Data” tab that brought her to a page, called “Data Tools & Apps Main,” that lists 36 different data search tools. Understandably, Diane became frustrated!

Unsure which tool to use, she asked for help. The Census employee accompanying us helped her get to the right page. Once there, Diane had another question: which geographic filter should she choose to narrow the scope of the data to Medford and its surrounding areas? Should she choose “Place”, “County Subdivision” or “Consolidated City”? The Census employee had to advise her on filtering the data to help her finish a seemingly simple query.

From observation to insight. Observing Diane surprised us in three ways.

  • First, we underestimated how much some users rely on Census data to do their jobs. Without the data, Diane couldn’t assess the feasibility of hiring diverse fire-fighters and police officers. This could mean that the City of Medford might not invest in the strategy—a missed opportunity for the Director of Human Diversity and Compliance.

  • Second, we didn’t appreciate the significant amount of personal support provided by Census employees to users. Diane wouldn’t have been able to achieve her task without the help of the Census employee with us. If Diane were searching for the data alone she would have likely contacted the Census by email or phone.

  • Third, we were surprised about how demoralised users can feel when they can’t find what they’re looking for. When Diane struggled, she didn’t blame the confusing layout of the website. Instead, she blamed herself. She felt that it was her fault that she couldn’t find the data. Over time, users who feel demoralised like Diane might avoid using the Census website, or conversely, might need more support from Census employees.

Next steps. Documenting Diane’s experience is just one example of the many research activities we’re doing to understand Census users better. Guided by design researcher Dana Chisnell, we’re obsessing about what users actually do and not just what they say they do. This means less talking and more listening. Most of all, it’s about observing, and listening with our eyes.

Luciano Arango, Nidhi Badaya, Aaron Capizzi, Rebecca Scharfstein, Peter Willis

Putting Census Data to Work


Deep within a data center in Suitland, MD, hundreds of computer servers make up one of the largest collections of information on people, businesses, and governments in the country. The data, including figures and statistics on income and households, emergency preparedness and health, education and trade, spans many decades and is worth a fortune to any business looking to understand the characteristics and habits of US residents.

But this information isn’t for sale - it’s for free, and the US Census Bureau collects it. Known mostly for their decennial survey that takes count of every person in America, the Census conducts hundreds of demographic and economic surveys every year, generating an array of valuable data in the process.

Five students at the Harvard Kennedy School are analyzing that trove as part of a new class, created by Adjunct Professor and former U.S. Deputy CTO Nick Sinai to focus on technology innovation in government. Comprised of data scientists, software gurus, and product managers, our team will interview public and private groups to analyze how Census data is leveraged today, and then design ways to improve the experience and access of those groups.

Data is only valuable when used, and each visitor to census.gov is looking for something different. Journalists want easily consumed facts and statistics, readily incorporated in a story to meet an urgent deadline. Researchers need flexible access to raw data to perform analyses and test hypotheses, while economists must sort through thousands of economic and social indicators to inform and drive policy decisions. States and cities also use Census reports when planning transportation projects or housing initiatives. The team will look at how tailoring data products and formats to suit individual customers could greatly increase their utility.

The amount of data collected by Census is vast. More than 130 surveys are being conducted at various times, and visitors to the Census website can search through decades of historic results and thousands of fact tables or graphs. While the Bureau compiles reports for easy public consumption, such as Income and Poverty in the United States: 2014, the data behind those reports is complex and difficult to parse for all but the most experienced or dedicated of analysts. Based on feedback, we will look at simple ways for more users to understand the variety of data offered and make use of it.

Interaction with Census data often occurs online, and creating an engaging user experience is key to cultivating repeat customers. Statistics show that most visitors to the Census website never return, although demand for data remains consistently high. Luckily, the question is not whether Census data can be useful; economic policy centers, watchdog groups, and the media are constantly on the hunt for meaningful trends hidden in the data. Rather, the question this team will answer is: how can Census data become most accessible to help drive well-informed economic and social analysis?

Luciano Arango, Nidhi Badaya, Aaron Capizzi, Rebecca Scharfstein, Peter Willis