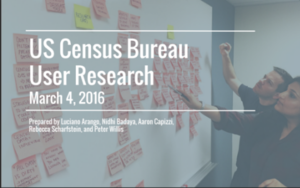
Census 2016
The Question
How can the Census Bureau help novice users find the information they need, especially around the topic of income inequality?
The Team
- Luciano Arango
- Nidhi Badaya
- Aaron Capizzi
- Rebecca Scharfstein
- Peter Willis

The Story

Deep within a data center in Suitland, MD, hundreds of computer servers make up one of the largest collections of information on people, businesses, and governments in the country. The data, including figures and statistics on income and households, emergency preparedness and health, education and trade, spans many decades and is worth a fortune to any business looking to understand the characteristics and habits of US residents.
This data is collected by the US Census Bureau. Known mostly for their decennial survey that takes count of every person in America, the Census conducts over a hundred demographic and economic surveys every year, generating an array of valuable data in the process.
Even though demand for data remains consistently high, statistics show that most visitors to the Census website never return.
While the Census is hard at work reinventing content management and customer service, there isn’t a project to redesign the census.gov homepage and simplify the site structure. To fill this gap, our team worked to help develop actionable recommendations for an updated Census.gov.
We decided to develop a low fidelity web page, a re-imagination of what the current income inequality topic page on the Census website could look like. We hope that this model will help provide a more streamlined user experience. In addition to our webpage, we included a set of recommendations to help improve internal organization and public accessibility. These recommendations can be seen in our final blog post.
We have learned a great deal and look forward to continuing to contribute to the U.S. Census Bureau’s important mission as it prepares for Census 2020.
Presentations
final insights presentation
user insights presentation

Blogs