This blog is the second in a series produced for a Harvard Kennedy School field class on innovation in government. Our team is working with the Census Bureau. You can read about our project here.
How do you know what someone really needs from a website? What questions do you ask? And how do you know when you’ve heard something really important?
We’ve been thinking about these questions a lot. In this section of our field class, we are researching the behavior of Census users. We’ve been learning that watching someone use a website—“listening with our eyes”—can be a powerful way of uncovering preferences and learning about user needs.
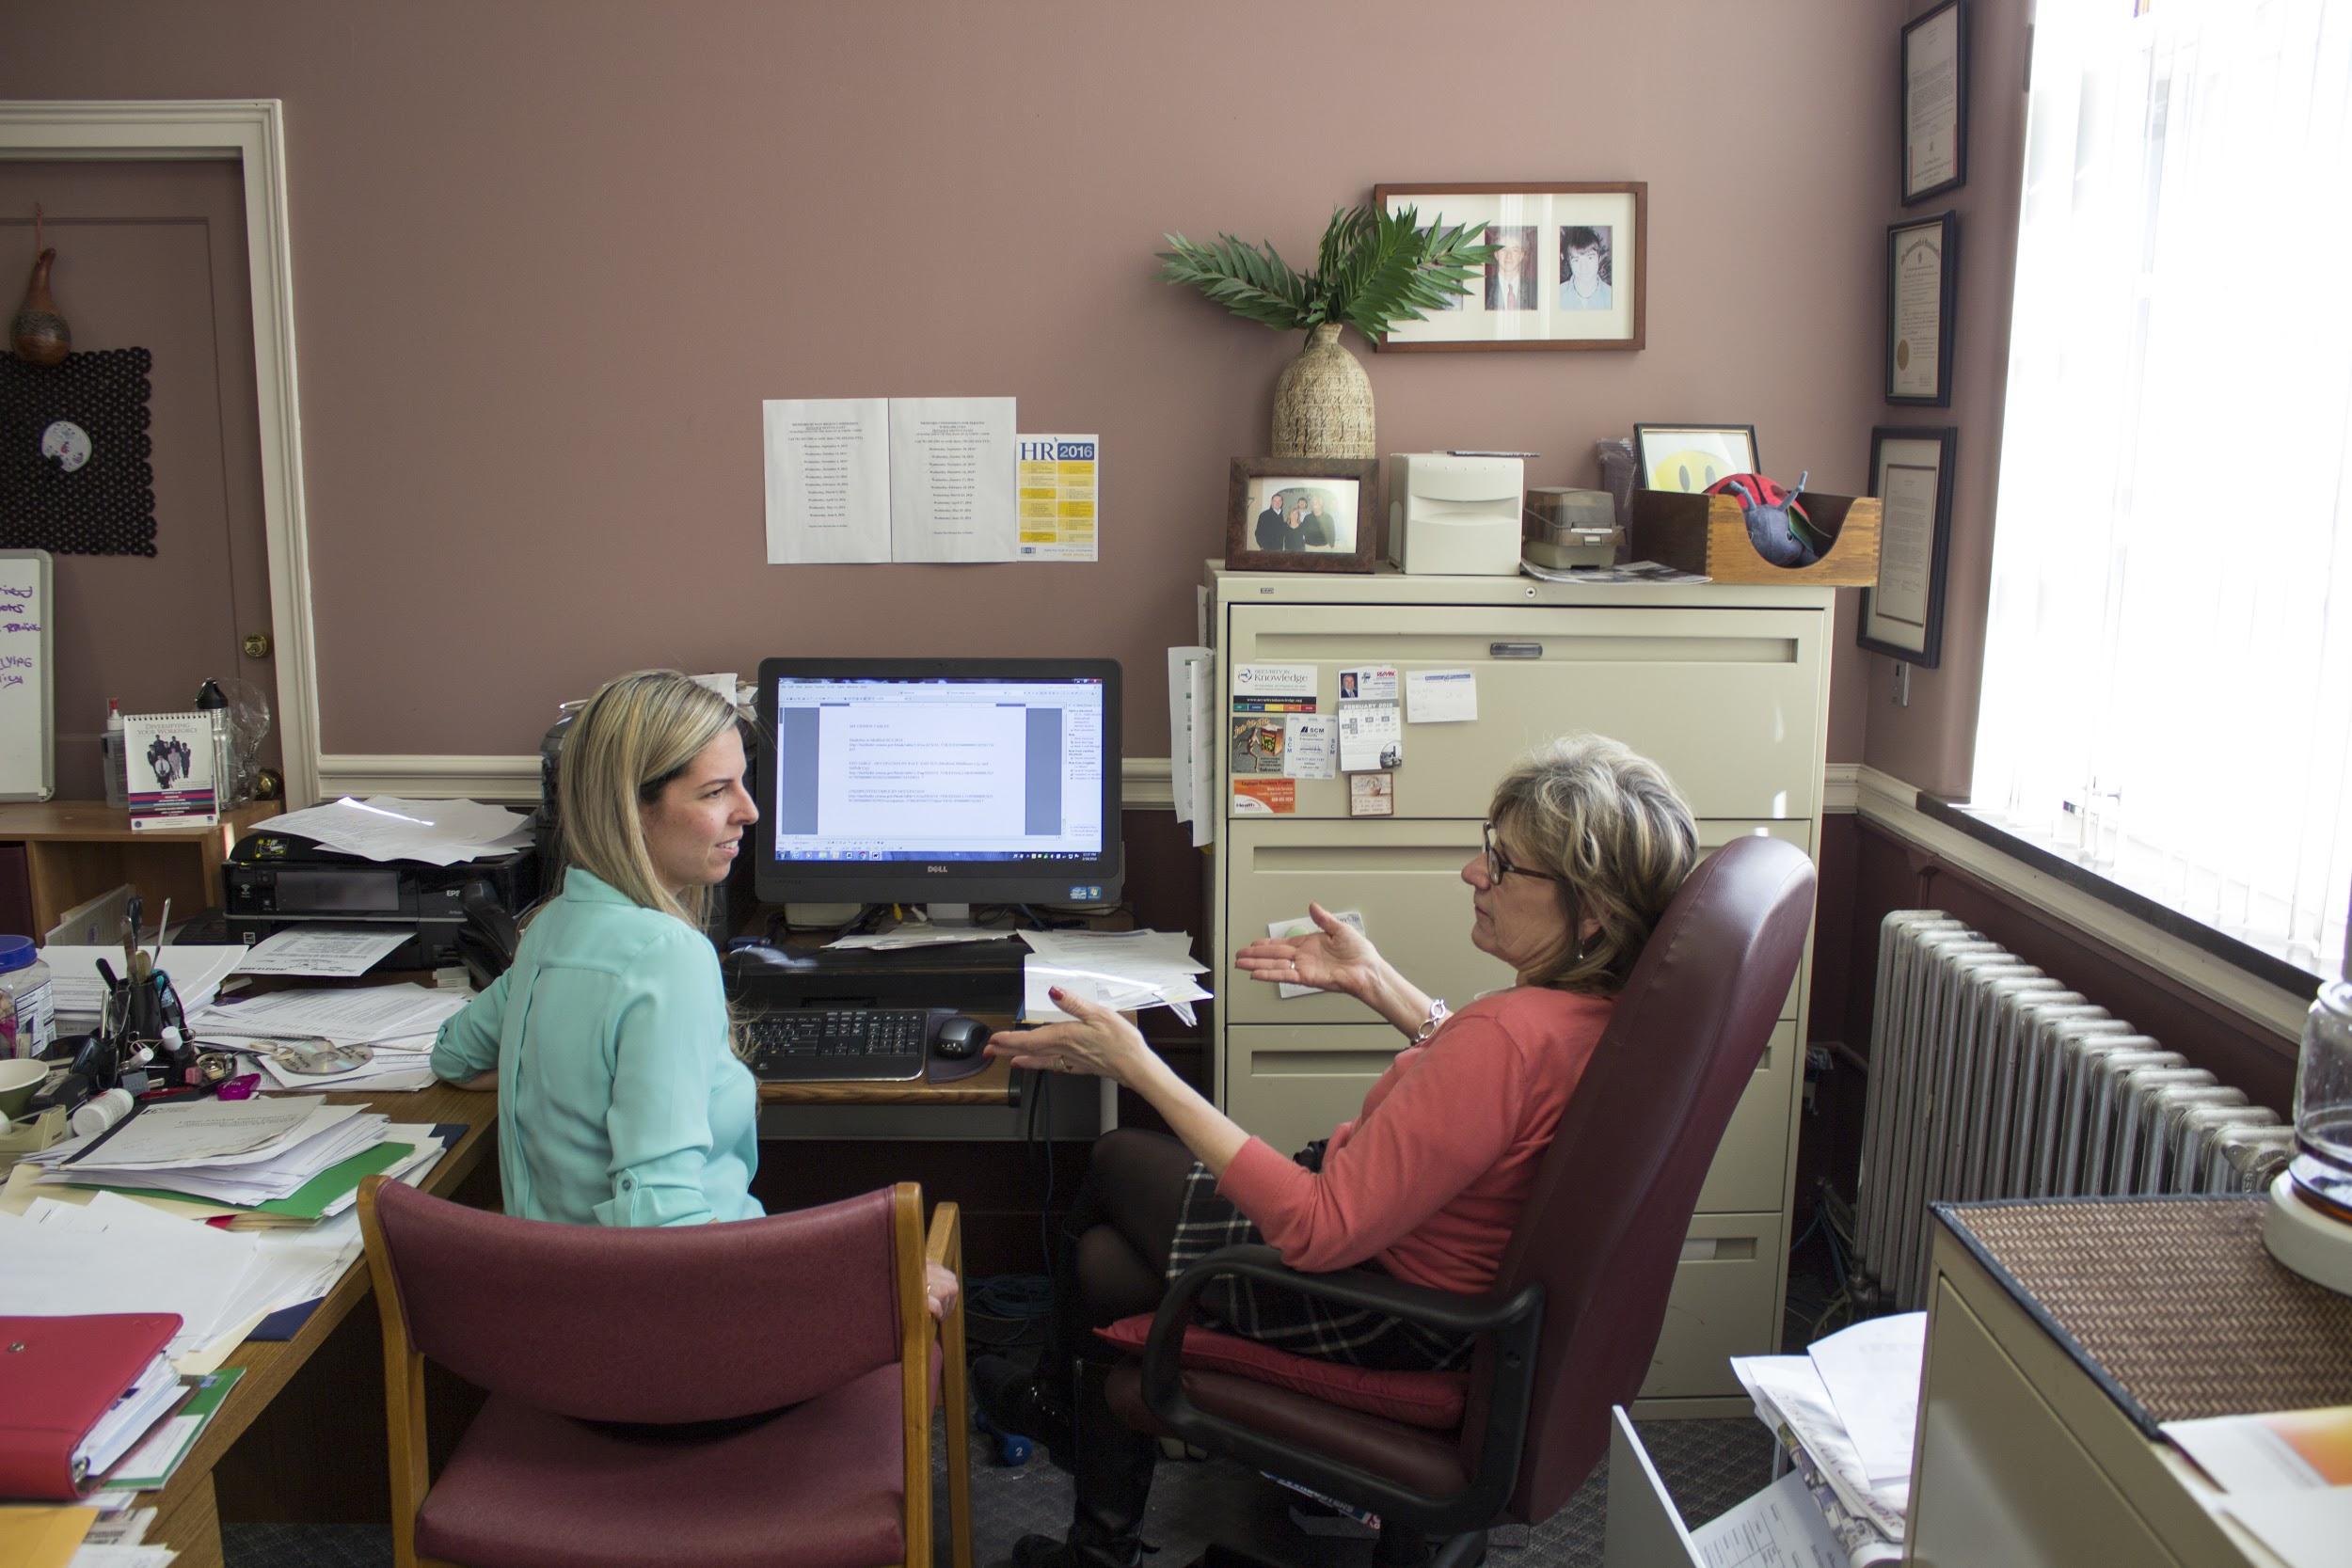
Diane’s story. The other week, in Medford, Massachusetts, we accompanied a Census outreach professional who met with Diane McLeod, the Director of Human Diversity and Compliance for the City of Medford.
Ten fire-fighters and police officers in Medford are retiring next year. Diane intends to replace them with new employees from diverse backgrounds.
It turns out Census has the exact data Diane needs. In the mostly likely scenario, Diane would need to:
Find and download data on the current demographic profile of Medford and its surrounding areas;
Filter the data to see the number of people who have been employed as fire-fighters or police officers; and
Filter the data again to see how many of those fire-fighters and police officers are currently unemployed.
We watched Diane try and find this information on Census’s website.
After first finding the main Census homepage, Diane was confused about what to do next. She tried clicking the “Data” tab that brought her to a page, called “Data Tools & Apps Main,” that lists 36 different data search tools. Understandably, Diane became frustrated!
Unsure which tool to use, she asked for help. The Census employee accompanying us helped her get to the right page. Once there, Diane had another question: which geographic filter should she choose to narrow the scope of the data to Medford and its surrounding areas? Should she choose “Place”, “County Subdivision” or “Consolidated City”? The Census employee had to advise her on filtering the data to help her finish a seemingly simple query.
From observation to insight. Observing Diane surprised us in three ways.
First, we underestimated how much some users rely on Census data to do their jobs. Without the data, Diane couldn’t assess the feasibility of hiring diverse fire-fighters and police officers. This could mean that the City of Medford might not invest in the strategy—a missed opportunity for the Director of Human Diversity and Compliance.
Second, we didn’t appreciate the significant amount of personal support provided by Census employees to users. Diane wouldn’t have been able to achieve her task without the help of the Census employee with us. If Diane were searching for the data alone she would have likely contacted the Census by email or phone.
Third, we were surprised about how demoralised users can feel when they can’t find what they’re looking for. When Diane struggled, she didn’t blame the confusing layout of the website. Instead, she blamed herself. She felt that it was her fault that she couldn’t find the data. Over time, users who feel demoralised like Diane might avoid using the Census website, or conversely, might need more support from Census employees.
Next steps. Documenting Diane’s experience is just one example of the many research activities we’re doing to understand Census users better. Guided by design researcher Dana Chisnell, we’re obsessing about what users actually do and not just what they say they do. This means less talking and more listening. Most of all, it’s about observing, and listening with our eyes.
Luciano Arango, Nidhi Badaya, Aaron Capizzi, Rebecca Scharfstein, Peter Willis