Motivating Boston Voters in Municipal Elections

Screen Shot 2020-08-03 at 4.17.20 PM.png

Why is municipal voter turnout so low in the City of Boston? And what should the City do about it? 

We set out to explore these questions as a team of Harvard students in the field class Tech in Innovation in Government. We’ve blogged about our journey so far:

  • Part 1: We spoke with Boston residents to understand their reasons for voting or not voting.

  • Part 2: We interviewed voters on Super Tuesday and analyzed Boston’s voter turnout data.

  • Part 3: We prototyped solutions for increasing voter turnout.

Pre-COVID-19

Based on our field research, we brainstormed a wide range of ideas to increase voter turnout. Some of our favorite ideas were:

  • SMS voter nudges: Targeted text messages to spur voter action and raise awareness of the election in the coming weeks.

  • Community outreach: Existing community centers and student groups could be used to distribute fliers.

  • Promotions: We envisioned making it easier for voters to get to the polls through promotions like waiving public transportation fares on Election Day.

  • Legislative changes: Other municipalities have created Election Day holidays to increase turnout. We proposed exploring these longer-term ideas, too.

The COVID-19 Pivot

In March, the onset of the COVID-19 pandemic and physical restrictions quickly changed our project. Harvard University closed and classes moved online. Many of our initial ideas to improve municipal voting—which relied on in-person interactions—were no longer practical.

One idea that became more compelling was reaching voters at home through the mail. This idea was gaining traction across the country. As demonstrated by the Wisconsin presidential primary, many jurisdictions began moving to vote-by-mail due to COVID-19 restrictions. We started to focus on reducing friction in the voting process through mailed communications to voters.

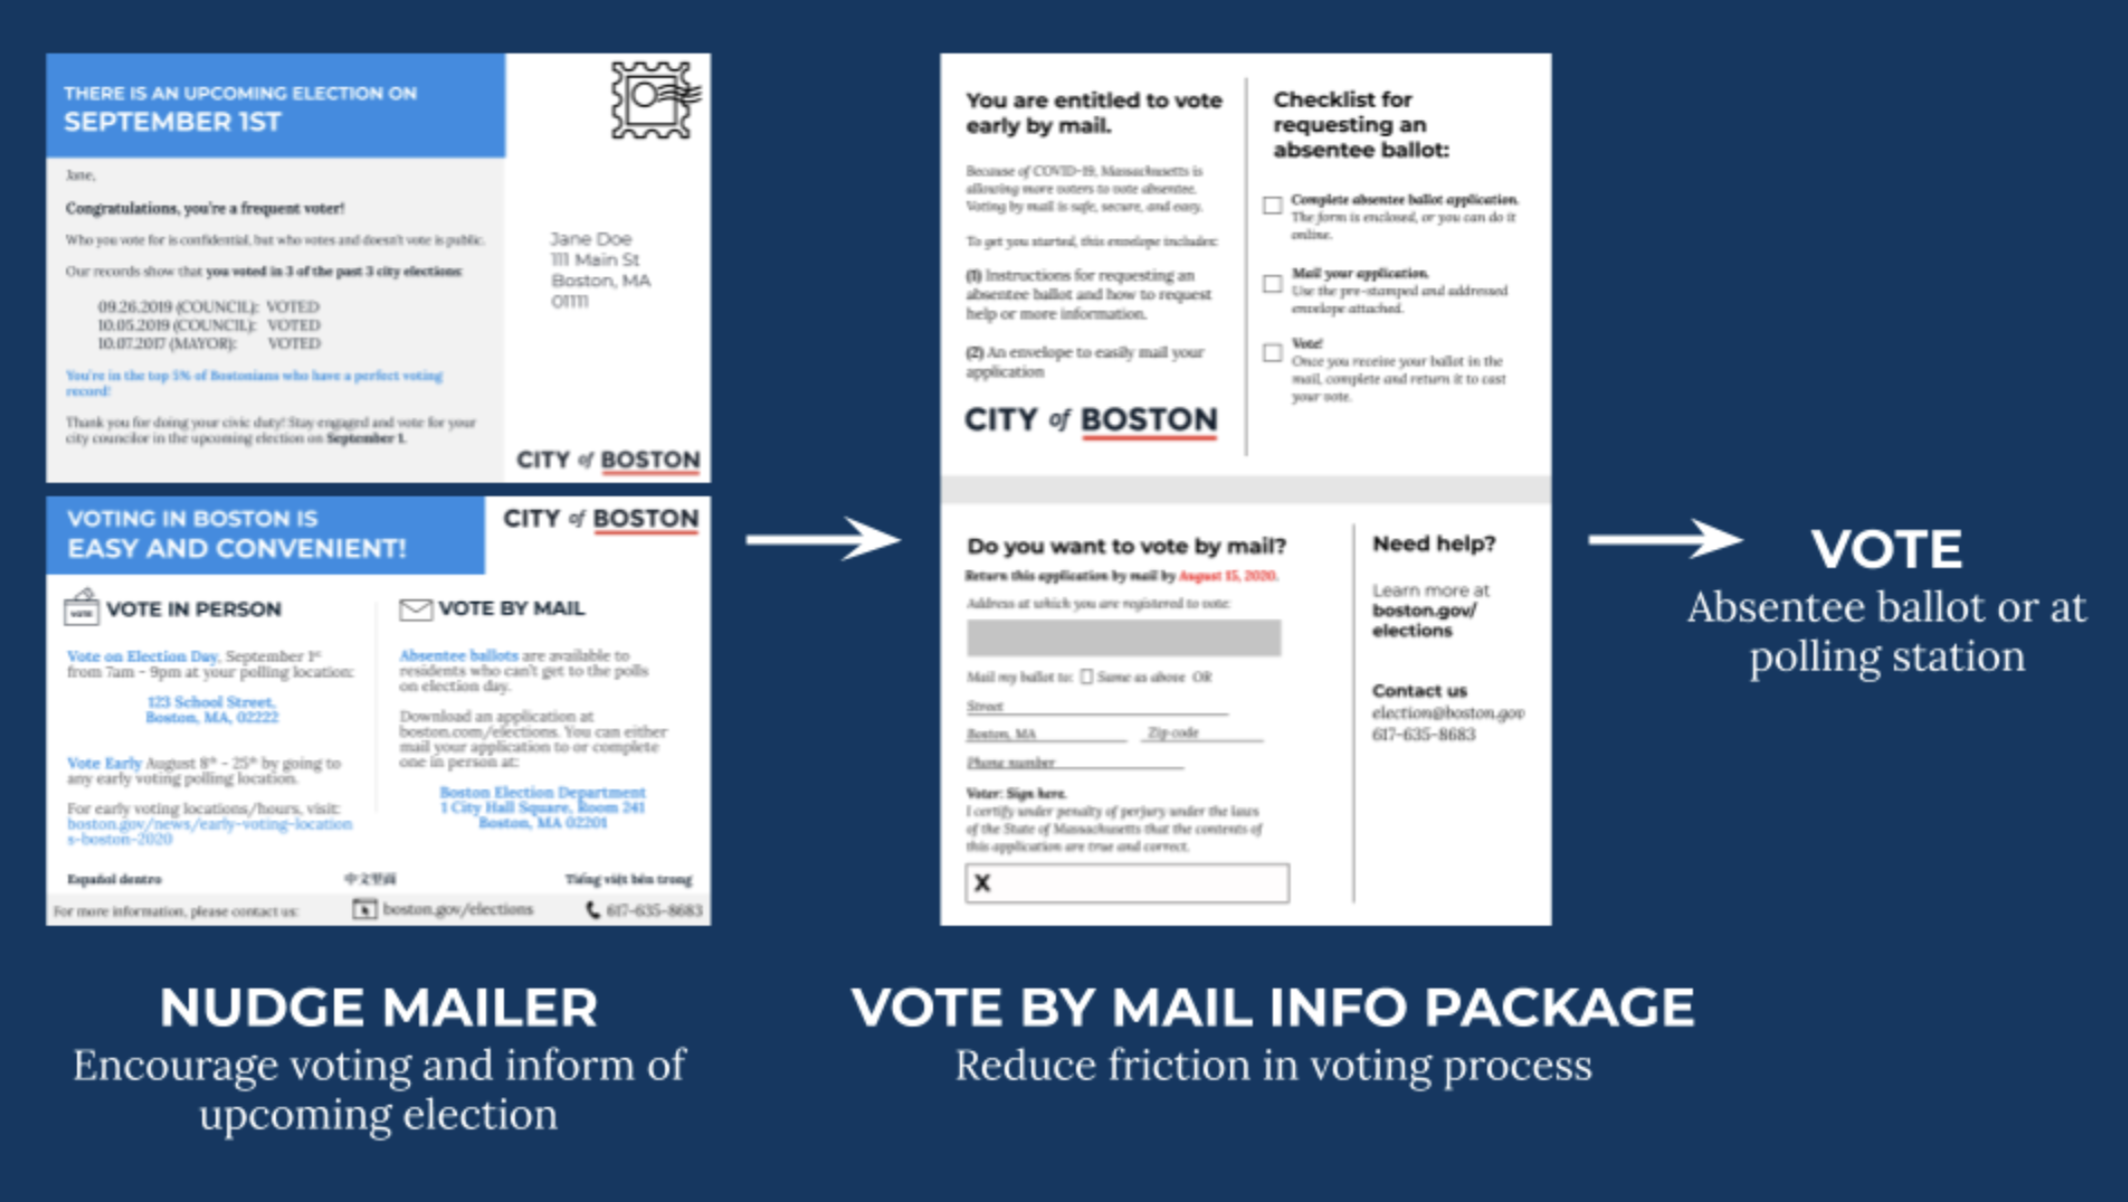
We decided to focus on two mail-based interventions: a behavioral “nudge” mailer and a vote-by-mail information package.

The New Plan

Nudge Mailer

We conceived this mailer based on the behavioral economics concept of “nudges,” which are frequently used to incentivize positive behavior. Notable examples of successful nudges include utility companies encouraging reduced energy usage and political campaigns increasing voter turnout. This New York Times article is a particularly helpful synthesis of existing research around using nudges for voting behavior.

Our research suggested that messages that focus on accountability, social comparison, and calls-to-action could make a nudge effective. We implemented all of these techniques in our nudge mailer.

Our nudge mailer is designed to:

  1. Inform residents about the upcoming election;

  2. Show the recipient that the City is aware of their voting behavior;

  3. Tell them how their voting behavior compares to others in Boston;

  4. Ask them to vote; and

  5. Show a clear process for voting.

We designed the nudge mailer to be a fold-out postcard—the size of a standard letter-sized sheet of paper folded in half. The mailer includes the nudge printed on the front, instructions for how to vote on the back, and translations in Spanish, Chinese, and Vietnamese inside.

Vote-by-Mail Package

Our work on the vote-by-mail package was informed by both ongoing civil discourse and existing research on vote-by-mail systems. 

Today, COVID-19 physical restrictions have sparked discussion about alternatives to in-person voting for fall municipal, state, and federal elections. Many states are exploring legislation that expands funding for vote-by-mail. Massachusetts customarily allows only certain voters to vote absentee, but it is temporarily relaxing those restrictions for spring and summer elections. Our vote-by-mail prototype was designed in the context of this ongoing debate and is meant to support the City’s work in ensuring fall elections are carried out safely.

To design the vote-by-mail prototypes, we leveraged research from the Center for Civic Design, a nonprofit that explores the application of user-centered design in electoral systems. The group has produced a toolkit of resources for developing and scaling vote-by-mail systems, including effectively communicating changes to voters and designing USPS-friendly materials. We also referenced research and resources from the National Vote at Home Institute.

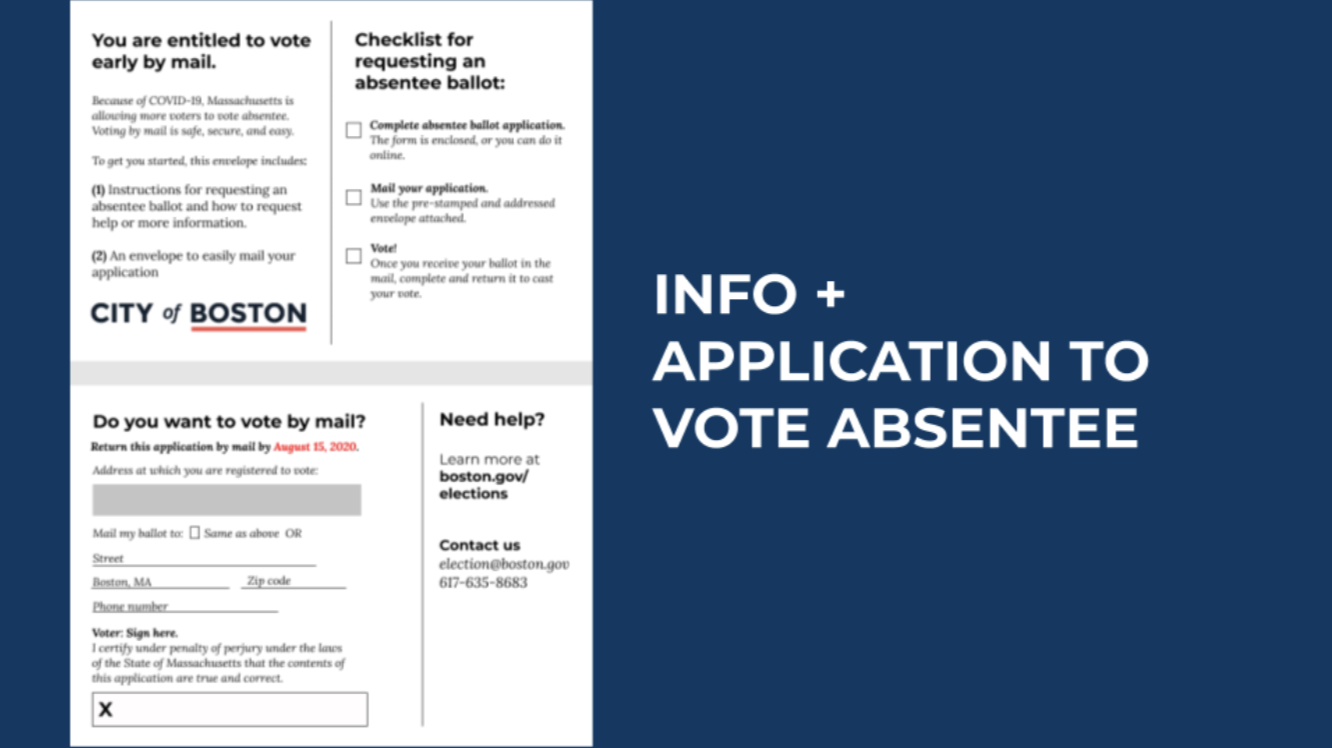
Our envisioned mailer communicates changes in vote-by-mail policies due to COVID-19 and enables registered voters to easily apply to vote absentee. The package includes an eye-catching multilingual envelope, an information card which includes an application to vote by mail and information about the process, and a pre-stamped and addressed return envelope. All materials are multilingual, with translations in Chinese, Vietnamese, and Spanish.

Our vote-by-mail package does rely on several assumptions about the fall municipal elections. First, it assumes that elections proceed on schedule. It also assumes that absentee requirements are relaxed, but that mail-in ballots continue to require an application. The mailer can be adapted if any of these conditions change. For instance, the application segment can be removed if the application requirement is waived. Moreover, if there are expanded in-person voting options, such as extended hours or drive-through voting, this information could be included in the mailer.

Screen Shot 2020-08-03 at 4.20.04 PM.png

Testing Our Concepts

To further refine these ideas, we tested our designs with Boston residents. Here’s an early detailed version that we put in front of prospective voters:

Screen Shot 2020-08-03 at 4.20.12 PM.png

With social distancing, we weren’t able to get voter feedback in person, so we needed to get creative in finding and reviewing designs with people.

One of our team members, Joanna Bell, had a great idea to find a group of residents on the neighborhood connection site NextDoor and gather feedback this way.

Screen Shot 2020-08-03 at 4.20.25 PM.png

Other group members reached out to their personal networks for feedback. We also used the testing platform UserTesting, an application where volunteers (who are paid to give quality feedback) walked through our prototype mailers and gave feedback in real-time. In all, we spoke with 20 Boston residents and gathered their insights about our mailers.

We tested design elements, language, and overall reactions to the mailers (e.g., would they really inspire behavioral change?). We sought to find people across a wide range of demographics, including residents who both regularly vote and regularly do not vote.

Nudge Mailer Feedback

Some voters were very honest with us!  Both positive and negative feedback helped us understand how to connect with our users and the best way to communicate with them.

The red ink on an early version was polarizing to some.  One resident told us, "it makes me think people are making fun of me, or criticizing me" and it was "demotivating".  

Another suggestion was to ensure the nudges were more positive and say "become one of the outstanding citizens by voting."  Another suggestion was that the mailer should say "your vote helps your community recover from COVID or something to that effect.”

A final suggestion was to change the wording to, “determine how your municipal money is spent by voting” and “be a part of government oversight by voting.”

Some of our early versions of the nudge postcard had details about past voting behavior and printed them out to motivate voters to do better.  Some people felt this was “creepy” and “Big Brother-ish.”  

There was a real debate within the team on how to best address the tension between accountability and creepiness: some discomfort might be tolerable if it helped to motivate the voters, but we ran the risk of going too far.  Ultimately, we chose a softer tone that still showed past voting participation, but in a more friendly manner.

Voter Information Mailer Feedback

Users gave us feedback on how to improve our design elements, including, “a little color wouldn't hurt anyone… Maybe a bold colored stripe or something simple enough yet eye-catching” and “the application deadline should be bigger.” 

Incorporating all the feedback and using the City’s design guide, we improved the prototype and tested the final version of our vote-by-mail package with a new set of residents. We received very positive feedback on the design, the clarity of the message, and the ease of navigation.

The majority of our people who tested this version said it was “concise and easy to follow”, “it has all the information you need and is not overwhelming unlike other government mailers,” and many also felt that it was quite “official-looking,” so they didn’t doubt that it was sent by a government source.

Final Versions

After several rounds of testing, we incorporated feedback into our final versions:

Screen Shot 2020-08-03 at 4.20.51 PM.png

Language accessibility was an important consideration. To make sure the information is available to a wide range of voters, we added translations in Spanish, Chinese, and Vietnamese 

Screen Shot 2020-08-03 at 4.20.56 PM.png
Screen Shot 2020-08-03 at 4.21.03 PM.png
Screen Shot 2020-08-03 at 4.21.10 PM.png
Screen Shot 2020-08-03 at 4.21.16 PM.png

Timing Counts

We recognized these mailers need to fit into the volume of communications residents receive from the City of Boston. We needed to find a time window that was close enough to the election to remind and nudge the voters into action, but be mindful of other communications and avoid our mailers being “lost in the pile” of mail from the city.  Below is our proposed timeline for our mailers.

Screen Shot 2020-08-03 at 4.21.21 PM.png

Thank You

We’re so appreciative of the City of Boston for their patience and flexibility during this most unusual semester project.  They stayed with us as we adjusted our approach and gave us consistently useful feedback to make our final products and ideas better.

The semester is finished, but none of us will ever look at a municipal election the same again.  We’ll always be comparing each one to Boston’s and analyzing how effective their outreach is! 

Special thanks to Dana Chisnell for her generous review of our work and her thoughtful ideas. Finally, a big thank you to Nick Sinai and the teaching team for their unwavering optimism during this semester. We couldn’t have made it without your leadership and willingness to march onwards.  

Joanna Bell, Dasha Metropolitansky, Sunaina Pumadarthy, Paul Rosenboom, Molly Welch


Brainstorming and Prototyping Ideas to Increase Municipal Voting

Every U.S. presidential election since 2000 has had over 50% voter turnout. In contrast, America’s municipal elections typically see between 20-27% of eligible voters cast a ballot. This percentage has been in decline over the past 20 years, suggesting that an unprecedented number of Americans are disconnected from their city government or municipal voting processes. 

Boston is no exception. Every four years, mayoral elections have anywhere from 28-38% voter turnout. City council elections fare even worse and typically see an abysmal 13-18% turnout.

Our team of students in DPI-663, a Harvard Kennedy School field class on Technology and Innovation in Government, is working with the City of Boston’s Elections Commission and the Department of Innovation and Technology to tackle low voter-turnout. Our goal is to develop policy recommendations and product prototypes that Boston can implement to improve turnout in future municipal elections. We’ll be conducting user research, developing prototypes, and testing them on Boston voters. We’re writing about this journey in a series of posts:

  • Part 1: We spoke with Boston residents to understand their reasons for voting or not voting. 

  • Part 2: We interviewed voters on Super Tuesday and dug into Boston’s voter turnout data.

The primary take-away from our research is that there are five main factors which determine whether a resident of Boston will vote in a municipal election: 

A screenshot from a presentation we delivered to our partners at the City of Boston

A screenshot from a presentation we delivered to our partners at the City of Boston

Now that we better understand the problem of low voter turnout in Boston, we turn to a more daunting task: figuring out how to tackle it.

Brainstorming

Our first step was exploring existing literature and case studies about increasing turnout in municipal elections. We read about interesting solutions proposed by and implemented in other cities with lower voter turnout: moving the election date to coincide with federal or state elections, offering free transportation on election day, encouraging community centers to host “Get to Know Your Ballot” events, giving out “Good Neighbors Vote” lawn signs, and more. 

We also met with Dana Chisnell, a co-founder of the Center for Civic Design—and, luckily for us, a lecturer at the Harvard Kennedy School! She pointed us to some helpful resources developed by the Center, such as templates for voter guides and vote-at-home envelopes. 

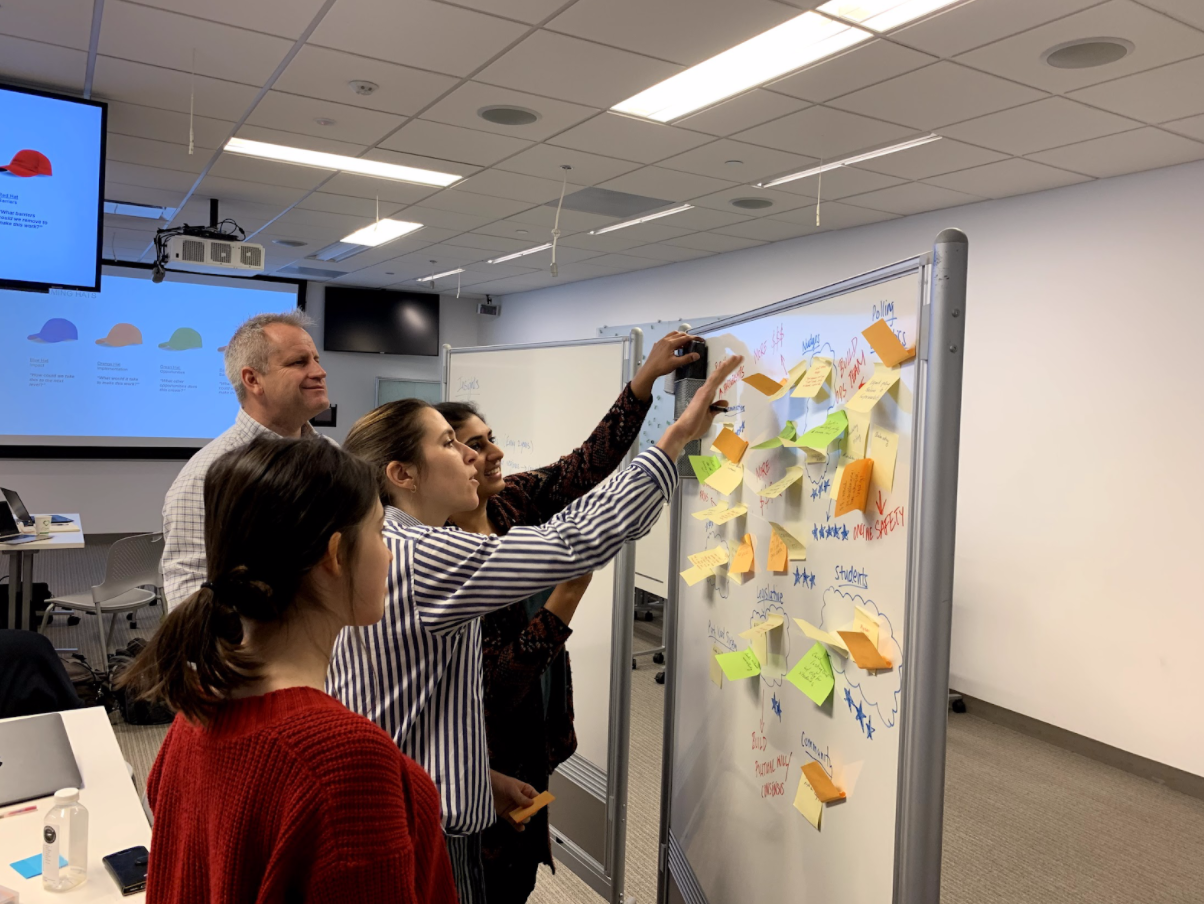
Drawing inspiration from our research and the meeting with Dana, we brainstormed as many solutions as possible for low turnout in Boston’s municipal elections with the help of sticky notes, colourful markers, and a giant whiteboard. We focused on developing solutions that would target at least one of the five factors influencing voter turnout, which we had discovered by interviewing Boston residents. 

Team members Paul, Sunaina, Molly, and Dasha brainstorm solutions

Team members Paul, Sunaina, Molly, and Dasha brainstorm solutions

Narrowing down our ideas

After the brainstorming exercise, we had around 50 ideas about how to improve voter turnout in Boston. We went through several methods of narrowing down this list of solutions.

First, we typed up our ideas from the brainstorming exercise and voted on our favorites. We used an emoji system to represent first, second, and third choice votes and a corresponding number of points.

An excerpt from our preliminary brainstorming document, including our “votes” cast

An excerpt from our preliminary brainstorming document, including our “votes” cast

Next, we presented the solutions with the highest point totals to our partners at the City of Boston. We ruled out solutions deemed infeasible, largely because of legal reasons (for example, we learned that the City can’t provide information about candidates on their website or social media, which was one of our suggestions) or uncertainty around the COVID-19 pandemic (a number of our ideas targeted young people since they have the lowest turnout rates, but our partners at the City pointed out that since students aren’t currently on campus and college administrators are preoccupied with planning around COVID-19, student-focused solutions might not be feasible in the short run). 

An excerpt from our list of top ideas. Our comments indicate feedback from partners at the City of Boston.

An excerpt from our list of top ideas. Our comments indicate feedback from partners at the City of Boston.

At this point, we had narrowed down our initial list of 50 solutions to 15. Our final step was to develop a set of criteria so we could systematically evaluate the remaining solutions.

Our evaluation criteria

Our evaluation criteria

Finally, after much discussion, we were left with three ideas to prototype and test: 

  • An expansion of vote-by-mail, which we considered particularly urgent given COVID-19 and, more generally, would make voting more convenient;

  • A mailer to serve as a behavioural nudge; and

  • Text message reminders to vote to raise awareness and boost interest in the election.

Prototyping

After we narrowed down the list of solutions, we started illustrating potential implementations. Our rough sketches are examples of low-fidelity prototypes, which are simple visual representations of a product with limited resemblance to the final design. This article captures why low-fidelity prototypes are so useful: they’re a “quick and easy way to translate high-level design concepts into tangible and testable artifacts.”

Here’s what we came up with: 

Screen Shot 2020-08-03 at 4.08.42 PM.png

This is a prototype for the behavioral nudge mailer where (1) is the back of the mailer and the front of the mailer is either (2) for frequent voters or (3) for nonvoters. In designing the mailer prototype, we applied three main take-ways from our research on effective get-out-the-vote strategies: 

  • Provide voting information: We do this on the back of the mailer (image 1) by including the election date and the recipient’s poll location. 

  • Help voters make a plan: We included a URL and a QR code which would link to a page on the City of Boston website where residents can plan their trip to the poll. We still have to discuss the webpage idea with our partners at the City. If we decide to proceed with further prototyping, it’s going to be important to test the “make a plan” feature: will Bostonians actually use the QR code or type the provided URL into their phone or computer? 

  • Use messages that exert a degree of social pressure: The three most common types of social pressure tactics we found were showing residents their past voting history, thanking people for voting in previous elections, and emphasizing that other people in the community are voting (multiple studies suggest that everyone-is-doing-it messaging is more effective at increasing turnout than don’t-be-part-of-the-problem rhetoric). We applied all three of these tactics in our prototype.

Screen Shot 2020-08-03 at 4.08.55 PM.png
Screen Shot 2020-08-03 at 4.09.03 PM.png
Screen Shot 2020-08-03 at 4.09.08 PM.png

This is a three-part prototype for revamping the vote-by-mail system in Boston. We sketched a notification mailer to residents letting them know that they can vote by email, a pre-stamped and addressed envelope, and updated information on the boston.gov website. Our next steps are to flush out the content of the mailer and figure out how to make it multilingual.

Screen Shot 2020-08-03 at 4.09.20 PM.png

Lastly, this is a prototype for text message reminders. From top left to bottom right, we sketched: (1) the alert, (2) the text sent 1 week before Election Day (3) the text sent 5 days before Election Day, (4) the text sent 3 days before Election Day, and (5) the text sent on Election Day. 

We thought that Boston residents would be more likely to read SMS reminders than emails (or even mailers!) as they are more personalized and easily accessible. We designed the reminders to address challenges we had discovered when speaking with Bostonians, such as not knowing when the municipal elections are, where their polling station is, etc. However, residents would have to opt-in to receive SMS updates, so the overall reach of this solution may be limited. 

Next steps

Over the coming weeks, our plan is to work with Boston residents to understand their perceptions and reactions to these prototypes. We’ll inevitably have many iterations of testing and editing according to their feedback before we’re ready to create a high-fidelity product for the City. We’re excited about where this process will take us!

Joanna Bell, Dasha Metropolitansky, Sunaina Pumadarthy, Paul Rosenboom, Molly Welch

Researching Voter Behavior in Boston

“People who look like me have died just for registering to vote.”

“I’m trying to make ends meet. I don’t have time to vote.”

“Local elections? All I care about is getting Trump out of office!”

These quotes from Boston residents are reflective of the problem we’re trying to solve—improving participation in local elections. Our team had the opportunity to interview over 60 Boston residents. We also conducted a deep dive into city data, exploring voter turnout and city demographics, to gauge where the real problem lies and ensure our envisioned solutions address the right pain points to increase voter turnout. 

Finding Boston voters

We traveled across Boston, on subways, trains, and buses, to locations as diverse as homeless shelters and Super Tuesday polling centers.

For most teams in our DPI-663 class at the Harvard Kennedy School, finding relevant users was a challenge. Our team was lucky in the sense that every person we would run into was a potential “user,” or Boston voter. Moreover, since Super Tuesday occurred during our research phase, we had the opportunity to speak to voters after they cast their vote. With the guidance of the Elections Department, we took to the polls to interview voters, mindful of the many guidelines that govern how outsiders can interact with voters to preserve the integrity of the democratic process. While many Super Tuesday voters were motivated by casting ballots in the Presidential primary, our team collected meaningful insights from these interviewees about Boston’s local elections. Many of the Super Tuesday voters were quite excited to engage with our project!

We decided to target wards and precincts with consistently low voter turnout and those with consistently high turnout so we could understand the differences in these communities and voter behavior across Boston. If you’d like to read more about how we determined which wards and precincts to visit, check out our data analysis work here

While our qualitative research may not have been representative of the entire voter population in the City of Boston, it was insightful in providing us with feedback on voters’ journey to polls and voters’ relationship with local governance at large. Many of the questions we asked voters revolved around their interaction with and perception of local government, whether they consistently vote in local elections (and why or why not), and whether they consider voting important.

The five target polling stations we chose for Super Tuesday, based on historical voter turnout data. Blue indicates low turnout precincts, and green indicates high turnout.

The five target polling stations we chose for Super Tuesday, based on historical voter turnout data. Blue indicates low turnout precincts, and green indicates high turnout.

Molly, Paul and Dasha (from left to right) at one of the polling centers (Ward 21 Precinct 2, Boston University) on Super Tuesday.

Molly, Paul and Dasha (from left to right) at one of the polling centers (Ward 21 Precinct 2, Boston University) on Super Tuesday.

Super Tuesday visit to another polling center (Ward 4 Precinct 10, Simmons University)

Super Tuesday visit to another polling center (Ward 4 Precinct 10, Simmons University)

From this research, we broadly categorized Boston residents into voter and non-voter profiles, or personas, below. Personas enable us to synthesize the results of our interviews and form the basis for potential solution development. 

Screen Shot 2020-08-03 at 4.02.48 PM.png
Screen Shot 2020-08-03 at 4.03.14 PM.png

The key takeaway from our field interviews was that the relationship between voters and their local government can be strengthened. Voters need to be convinced that their vote matters and that the city plays a large role in making their daily lives hassle-free. The communication gap is evident; one solution may be that the City of Boston should ramp up efforts to convince residents that casting their ballot can have a concrete impact on the city’s present and future.

Another interesting observation from our weeks of user research is that while residents discover information about the voting process through social media and local websites, networking or person-to-person contact is what gets people to the polling stations. Voting for many is seen as a social activity. Leveraging these “network effects” may also be worth exploring.

Digging into the numbers

Our qualitative research is limited to the users we’re able to access, raising questions of population representativeness. We wanted to supplement our 60+ voter interviews to better understand the scope of the problem.

To tackle this, our team supported our field interviews with quantitative research. We studied voter turnout from 2005 to 2017 and overlaid this analysis with neighborhood-level demographics to try to analyze what was really happening in Boston during local elections. 

There were four key take-aways from our quantitative analysis:

  1. Election turnout is much higher in years with mayoral elections (2005, 2009, 2013, 2017) than those with just City Council elections.

  2. Turnout varies widely across Boston’s precincts: there’s anywhere from a 38 to 70 percentage point gap between the lowest turnout precinct and the highest turnout precinct in a given election year.

  3. Low turnout precincts in Boston are consistently low turnout, whereas high turnout precincts are, for the most part, not consistently high turnout. From a policy perspective, we should examine what low turnout areas have in common rather than focusing on features of high turnout areas.

  4. Low turnout areas tend to have any or all of the following features: few people who have lived in the neighborhood for at least a year, a large population, a high poverty rate, and many university students. Note that all of these features are relative to the average Boston precinct.

Check out the full data analysis here. The code and data we used can be found here.

* * *

While we plan to continue with user research, our next step is to test some of the potential solutions our team has developed in the course of interviews and data analysis. In the coming weeks, we will be working closely with the City of Boston to begin prototyping potential interventions. Our goal is to create a series of prototypes through iterations as we continue to gather feedback from the users before we have our final solution laid out.  

Stay tuned for updates from our testing and prototype phase!

Note: All of the user research was done before the COVID-19 outbreak in the United States. Our team is committed to working with the City of Boston and designing solutions with the health of citizens as a top priority. We continue to engage with this project remotely.

Joanna Bell, Dasha Metropolitansky, Sunaina Pumadarthy, Paul Rosenboom, Molly Welch
Why Don’t Boston Residents Vote in City Elections?

(from left to right) Molly Welch; Joanna Bell; Dasha Metropolitansky; Eneida Tavares, Chair, City of Boston Board of Election Commissioners; Emily Quinn, City of Boston Marketing Coordinator; and Paul Rosenboom.

(from left to right) Molly Welch; Joanna Bell; Dasha Metropolitansky; Eneida Tavares, Chair, City of Boston Board of Election Commissioners; Emily Quinn, City of Boston Marketing Coordinator; and Paul Rosenboom.

In the city of Boston, only one in six registered voters vote in municipal elections—a participation rate almost four times lower than state and federal elections. What’s driving that disparity? And what can the city government do to address it?

That’s the challenge we’re setting out to solve as part of Tech and Innovation in Government, a Harvard field class where students use user-centered design to solve government problems.


Our team and challenge

We’re a group of five students with a range of backgrounds, including technology, international development, and civic engagement.


  • Joanna Bell is a Masters in Public Policy student at the Harvard Kennedy School with a background in digital literacy and interest in municipal government.

  • Dasha Metropolitansky studies statistics (the data science track) and computer science at Harvard College and is interested in predictive analytics and game theory.

  • Sunaina Pumadarthy is a Masters in Public Policy student at the Kennedy School, who has previously worked on elections campaigns in India.

  • Paul Rosenboom is a Mid-Career Masters in Public Administration student at the Kennedy School, who previously worked in aerospace and the Peace Corps Madagascar.

  • Molly Welch is a joint Masters in Public Policy and Masters in Business Administration student at the Kennedy School and Harvard Business School who previously worked on marketing and public policy at Google.


Over the next two months, we’ll be working with the City of Boston’s Board of Election Commissioners to increase resident turnout in local municipal elections. 

Historically, the City has seen between 11% and 16% of registered voters participate in municipal elections. It’s a stark comparison to the approximately 75% of registered voters that generally turn out for federal elections. The City is eager to increase resident participation in municipal elections. 


Understanding the problem 

To begin, we sought to develop a deeper understanding of the problem. What do Boston residents think about local government and municipal elections? What influences their voting behavior?

We spoke with seven public transit riders on the MBTA train and asked them about their voting behavior and perception of municipal government. As we learned more about why people vote, it became clear that the quality of the relationship between the voter and the City mattered.

The people we spoke to who voted in local elections knew what to expect from their city government and why the government was important to them. The people who didn’t vote felt disconnected and couldn’t think of a reason why they would even call the city. Several individuals mentioned the city was “not accessible” to them. One resident mentioned that she wasn’t sure what city government does.

We also found that the longer a person lived in Boston, the more likely they were to have voted. Though our sample was too small to establish generalizable conclusions, we consistently saw that interview subjects who had lived in their communities for over a year were more likely to vote than newcomers. We also found that friends and family matter: many interviewees indicated that their social circles were influential in their decision to vote.

With these insights, along with information from our partners at the City of Boston about their objectives, we framed our focus this semester: “How might we increase voter participation in municipal elections for the City of Boston?” 


What’s next?

Our initial qualitative research with Boston residents gave us some working hypotheses about perceptions of voting and barriers to voting. Next, we plan to analyze historical voting patterns across the city to see how turnout varies across precincts and polling places.

We also want to speak with more Boston residents. Over the next few weeks, we’ll be conducting more interviews in different parts of the city. We’ve also developed an online survey about voting behavior that we plan to broadly disseminate. 

Finally, we’re planning on connecting with individuals and groups with direct access to communities of voters, including Neighborhood Liaisons and voter advocacy groups. We hope these groups will expand our understanding of barriers to voting and share more about potential solutions with which they’ve already experimented.

It’s going to be an exciting semester as we work to improve Boston residents’ engagement with local government! Ultimately, we hope to develop recommendations for the Boston Board of Election Commissioners. We’re also lucky that we’ll be able to witness the upcoming local election, which will give us a chance to see the electoral process in action.

We’ll be sharing updates along the way. If you’re interested in learning more, follow along on our course blog.

Joanna Bell, Dasha Metropolitansky, Sunaina Pumadarthy, Paul Rosenboom, Molly Welch