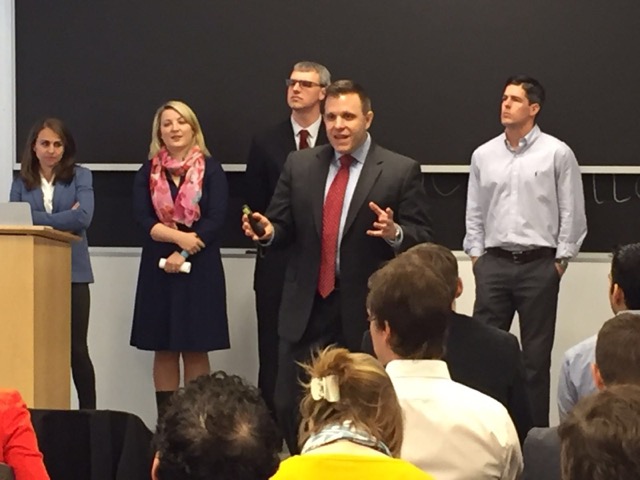
We made it! After twelve weeks of hard work and many struggles with unforeseen obstacles, our team of five Harvard students has made it to this critical point. We are about to present to our client, the New York City Department of Buildings, the result of our course “Tech and Innovation in Government” at Harvard Kennedy School. It is finally Demo Day!
When we embarked on this class and the project for the Department of Buildings at the end of January, every team member brought a different skillset to the table: Anthony Arendt had just finished a course in design thinking. The Daniels in the team, Daniel Bacon and Daniel Wagner, were both keen data analysts. In addition, Dan Bacon had a coding background, while Daniel Wagner’s training in policing added important experiences to team discussions. Howaida Kamel contributed her expertise in design, urban planning and data analysis, while Kirsten Rulf brought a decade-long experience in journalism to the table, including proficiency with thousands of interviews and storytelling.
At times, it was hard to see how we could combine these diverse skills effectively for prototyping. Working together has been one of the big challenges of the course with team members from two schools, four different courses, and five different schedules. Identifying the right users has been another one. But today, on the last day of the class, the demo day, we are proud to get up from our front-row seats as a team and present not one, but two prototypes to our client Rey Cabrera and the audience of Harvard faculty, students, friends and family in the Harvard iLab.
Digital Form Prototype
Early on in our user research journey, we discovered that the form that inspectors use to document building accidents was too complex. Hardly anyone used the paper form, because it was just impractical. Our prototype of a digital form offers inspectors a much simpler and faster way to enter accident information. Using Qualtrics, we built survey that inspectors can fill out on a tablet and that automatically links the data to the database.
Management Dashboard Prototype
During the last three weeks of the course, we extensively tested the idea of a graphical representation of the most important accident data for managers. We set several versions in front of our users. The result is a two-page weekly safety report.
Both prototypes have the potential for scaling. So alongside the two prototypes we provided the Department of Buildings with a set of actionable recommendations. They include the suggestion to hire more data analysts that can recreate our weekly safety brief and the proposal of a process for solid data collection and assessment. As our twelve weeks with the Department of Buildings come to an end, we hope that our ideas will help them continue on their important mission to make New York City construction sites a safer place for everyone.
Anthony Arendt, Dan Bacon, Howaida Kamel, Kirsten Rulf and Daniel Wagner


